The official IELTS by IDP app is here! Download it today.


IELTS Academic Writing Task 1 asks you to summarise, describe or explain information presented visually.
You may be given a graph, chart, table, process, map or another visual representation of information.
Your task is to identify the important features and present them clearly and accurately.
What Types of Questions Can Appear in Academic Writing Task 1?
You may encounter:
Combinations of visual information
The key skill is not simply describing every detail. You need to identify the main features and make relevant comparisons where appropriate.
How to Structure IELTS Writing Task 1
Introduction
Paraphrase the question to introduce what the visual information shows.
Overview
Give a clear summary of the most important trends, differences, stages or features.
Body Paragraphs
Support your overview with relevant details and comparisons from the visual information.
What Makes a Strong Task 1 Response?
A strong response should:
Address the information presented.
Include a clear overview.
Select relevant details.
Make appropriate comparisons.
Organise ideas logically.
Use accurate vocabulary and grammar.
IELTS Writing Task 1 Sample Question & Answer
IELTS Bar Chart Practice Samples (Question with Answer)
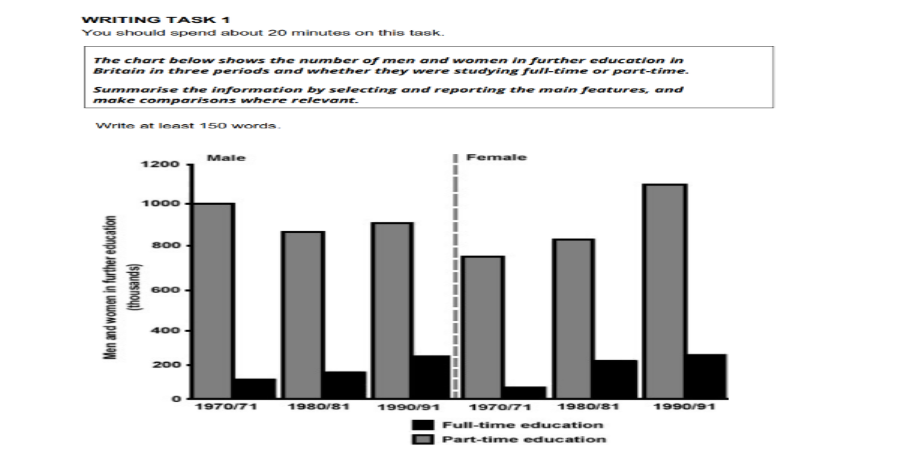
Here is an IELTS bar chart sample question with answers for your reference:
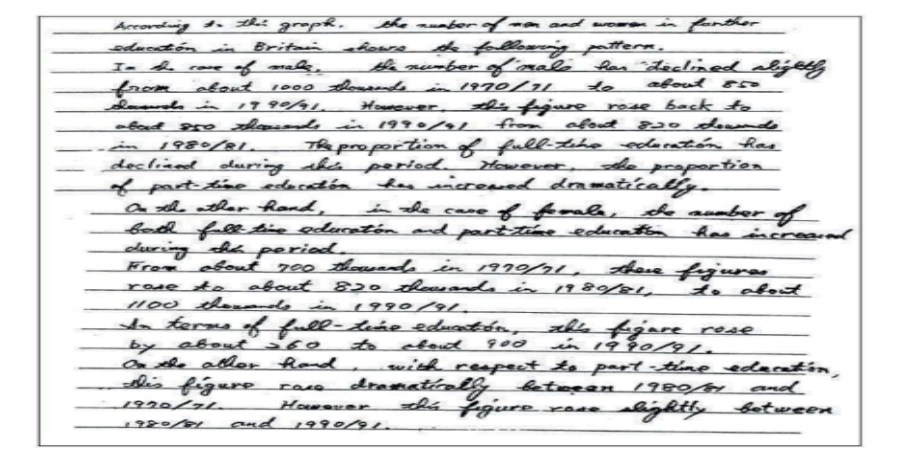
Sample answers for band 7:
IELTS Line Graph Practice Samples (Question with Answer)
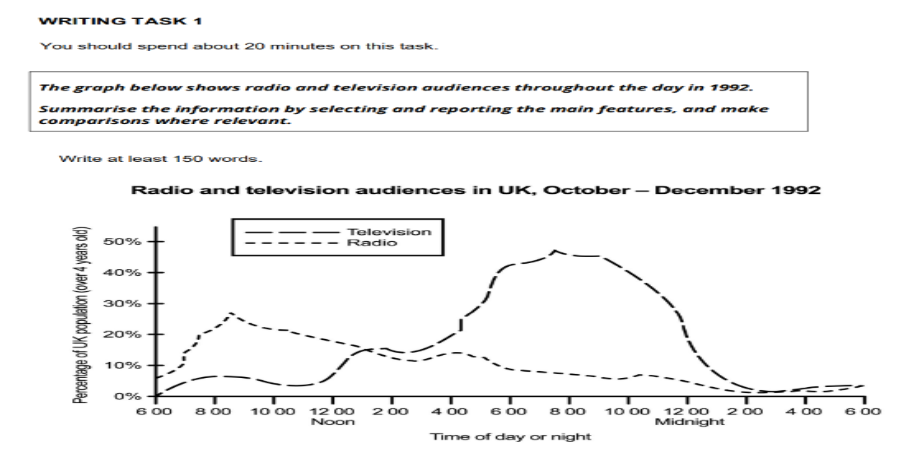
You can refer to this line graph sample question with answers to get familiar with it:
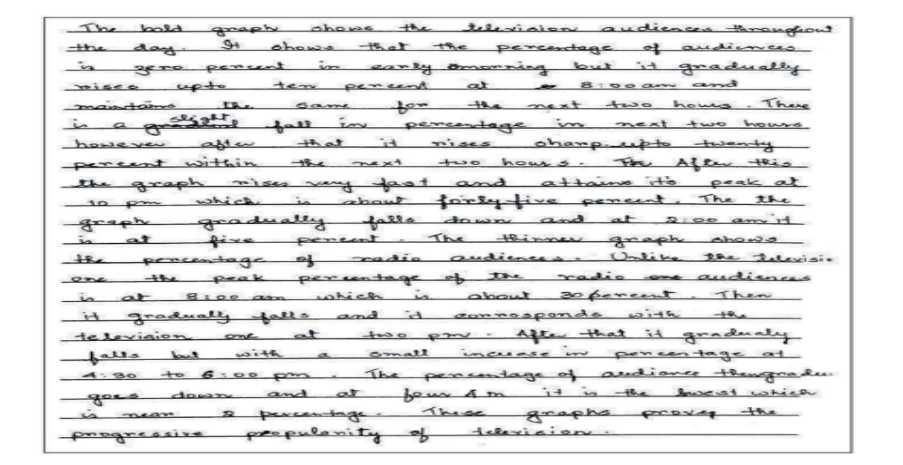
Sample answers for band 7:
IELTS Pie Chart Practice Samples (Question with Answer)
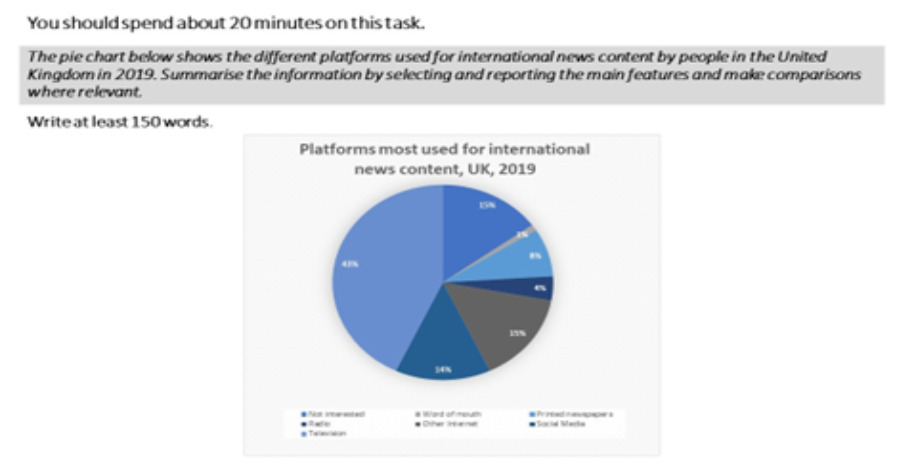
Here is an IELTS pie chart task 1 sample question with answers for your reference:
Sample answers for band 7:
The pie chart shows how people in the UK accessed international news in 2019. TV was the most popular choice, with 43% of people using it. Word of mouth and radio were the least popular options, chosen by only 1% and 4% of people respectively. Printed newspapers were used by 8% of people, showing some interest but not as much as TV. Social media and other internet sources were used by a combined 29% of people, with social media being slightly more popular at 14% and other internet sources at 15%. This means that a lot of people in the UK turned to the internet, including social media, to get their international news. Overall, TV was the top choice, while traditional methods like radio and word of mouth were less popular, and the internet played a big role in providing news.
IELTS Table Chart Practice Samples (Question with Answer)
Here is an IELTS table chart task 1 sample question with answers for your reference:
The table below shows General Practice (GP) appointment attendance in the United Kingdom over six days in January 2020.
Summarise the information by selecting and reporting the main features, and make comparisons where relevant.
Write at least 150 words.
GP appointment attendance in the UK, January 2020
Day | Total appointments | Appointments attended |
|---|---|---|
Sunday 5th | 5,710 | 87% |
Monday 6th | 1,385,000 | 91% |
Tuesday 7th | 1,277,000 | 90% |
Wednesday 8th | 1,203,000 | 90% |
Thursday 9th | 1,189,000 | 90% |
Friday 10th | 1,173,000 | 91% |
Sample answers for band 7:
The table presents data on the attendance of General Practice (GP) appointments in the UK over a six-day period in January 2020. The data reveals the total number of appointments, the percentage of appointments attended, and the percentage of appointments missed.
The highest number of GP appointments was recorded on Monday, January 6th, with 1,385,000 appointments, where 91% were attended, and 4% were missed. In contrast, the lowest number of appointments occurred on Sunday, January 5th, with only 5,710 appointments, of which 87% were attended, and 6% were missed.
Throughout the week, from Monday to Friday, the percentage of attended appointments remained relatively consistent, ranging between 90% and 91%. However, the percentage of missed appointments varied slightly, from a low of 3% on Thursday, January 9th, to a high of 5% on Tuesday, January 7th, and Friday, January 10th.
It is noteworthy that while the number of appointments was significantly higher on weekdays, the percentage of attendance was slightly lower on Sunday. This suggests that fewer people schedule GP appointments on Sundays, and those who do are slightly less likely to attend them.
Overall, the data demonstrates a strong attendance rate for GP appointments during this period, with slight variations across the different days of the week.
IELTS Process Diagram Practice Samples (Question with Answer)
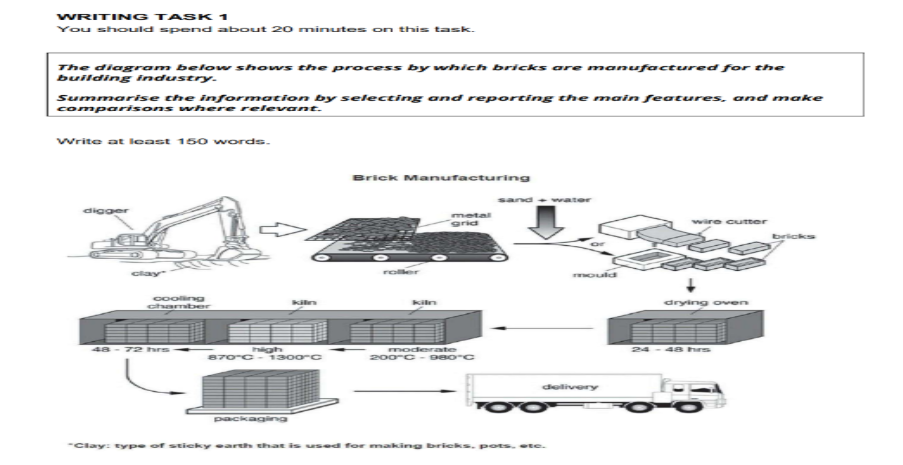
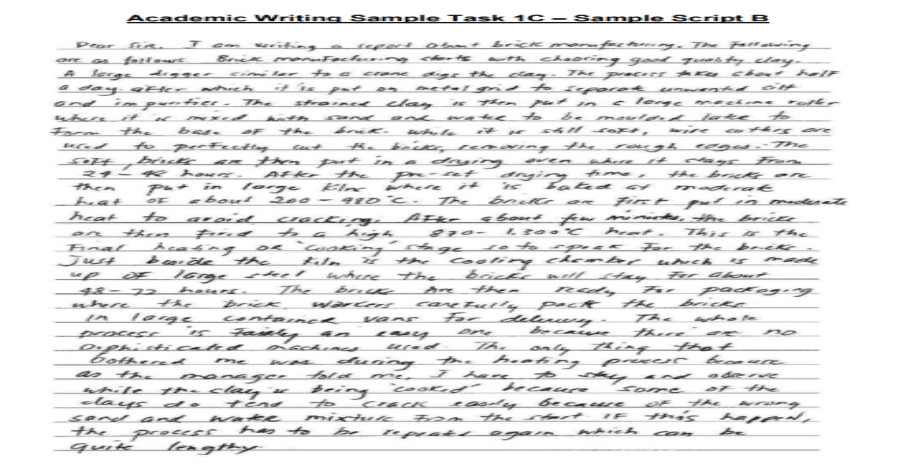
Here is an IELTS process diagram task 1 sample question with answers for your reference:
Sample answers for band 7:
IELTS Map Practice Samples (Question with Answer)
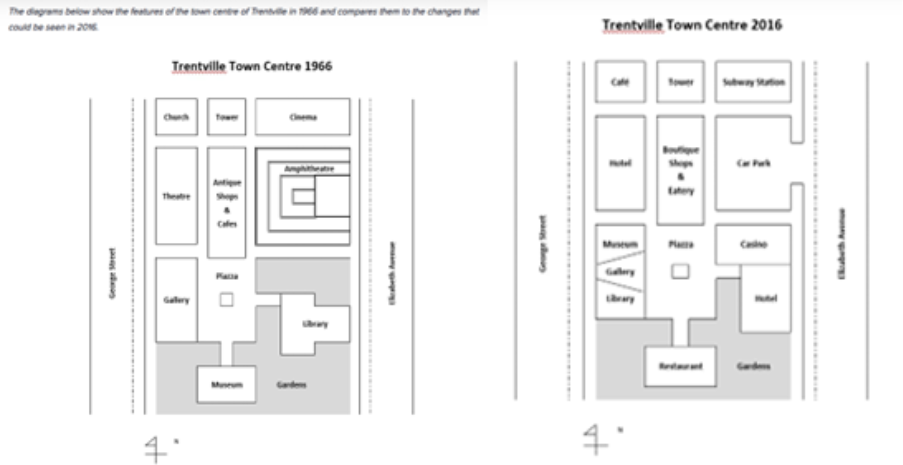
Here is an example of an IELTS map question for your reference:
Sample answers for band 7:
The two maps illustrate the significant changes in the town centre of Trentville between 1966 and 2016.
In 1966, the town centre had several prominent features, including a church, theatre, and cinema situated on the northern side. An amphitheatre was centrally located, surrounded by antique shops and cafés, while the southern part of the town housed a library, museum, and gardens. The central area featured a piazza, with a gallery and antique shops to the west and a church and theatre to the northwest.
By 2016, the town centre had undergone extensive development. The amphitheatre was replaced by a boutique shop and eatery. The cinema and church in the north had been replaced by a subway station and café, respectively. The area around the former theatre was converted into a hotel. The central piazza remained, but the area to the east saw significant changes, with the addition of a car park and casino. To the south, the museum and gallery retained their original locations, while the library area now accommodated a new restaurant.
Overall, the changes reflect a shift from cultural and religious facilities towards more commercial and leisure-oriented developments, indicating a modernization of the town centre over the past 50 years.
Common IELTS Academic Writing Task 1 Mistakes
Writing a conclusion instead of an overview
Task 1 requires an overview of the main features. Don't treat it like an essay that needs a conventional conclusion.
Listing every number
Including every figure can make your response unfocused. Select figures that support the key trends or comparisons.
Giving personal opinions
The task is based on the information provided. Avoid adding unsupported opinions about the data.
Describing without comparing
Where the visual information allows comparison, show the relationship between important features.
How Can You Practice Task 1?
Start by identifying the visual type and its main features. Then practise writing introductions and overviews before moving to complete timed responses.
Improve Your Writing on the App
Working on Academic Writing Task 1? Learn from expert-prepared content and build your IELTS skills with resources in the app.